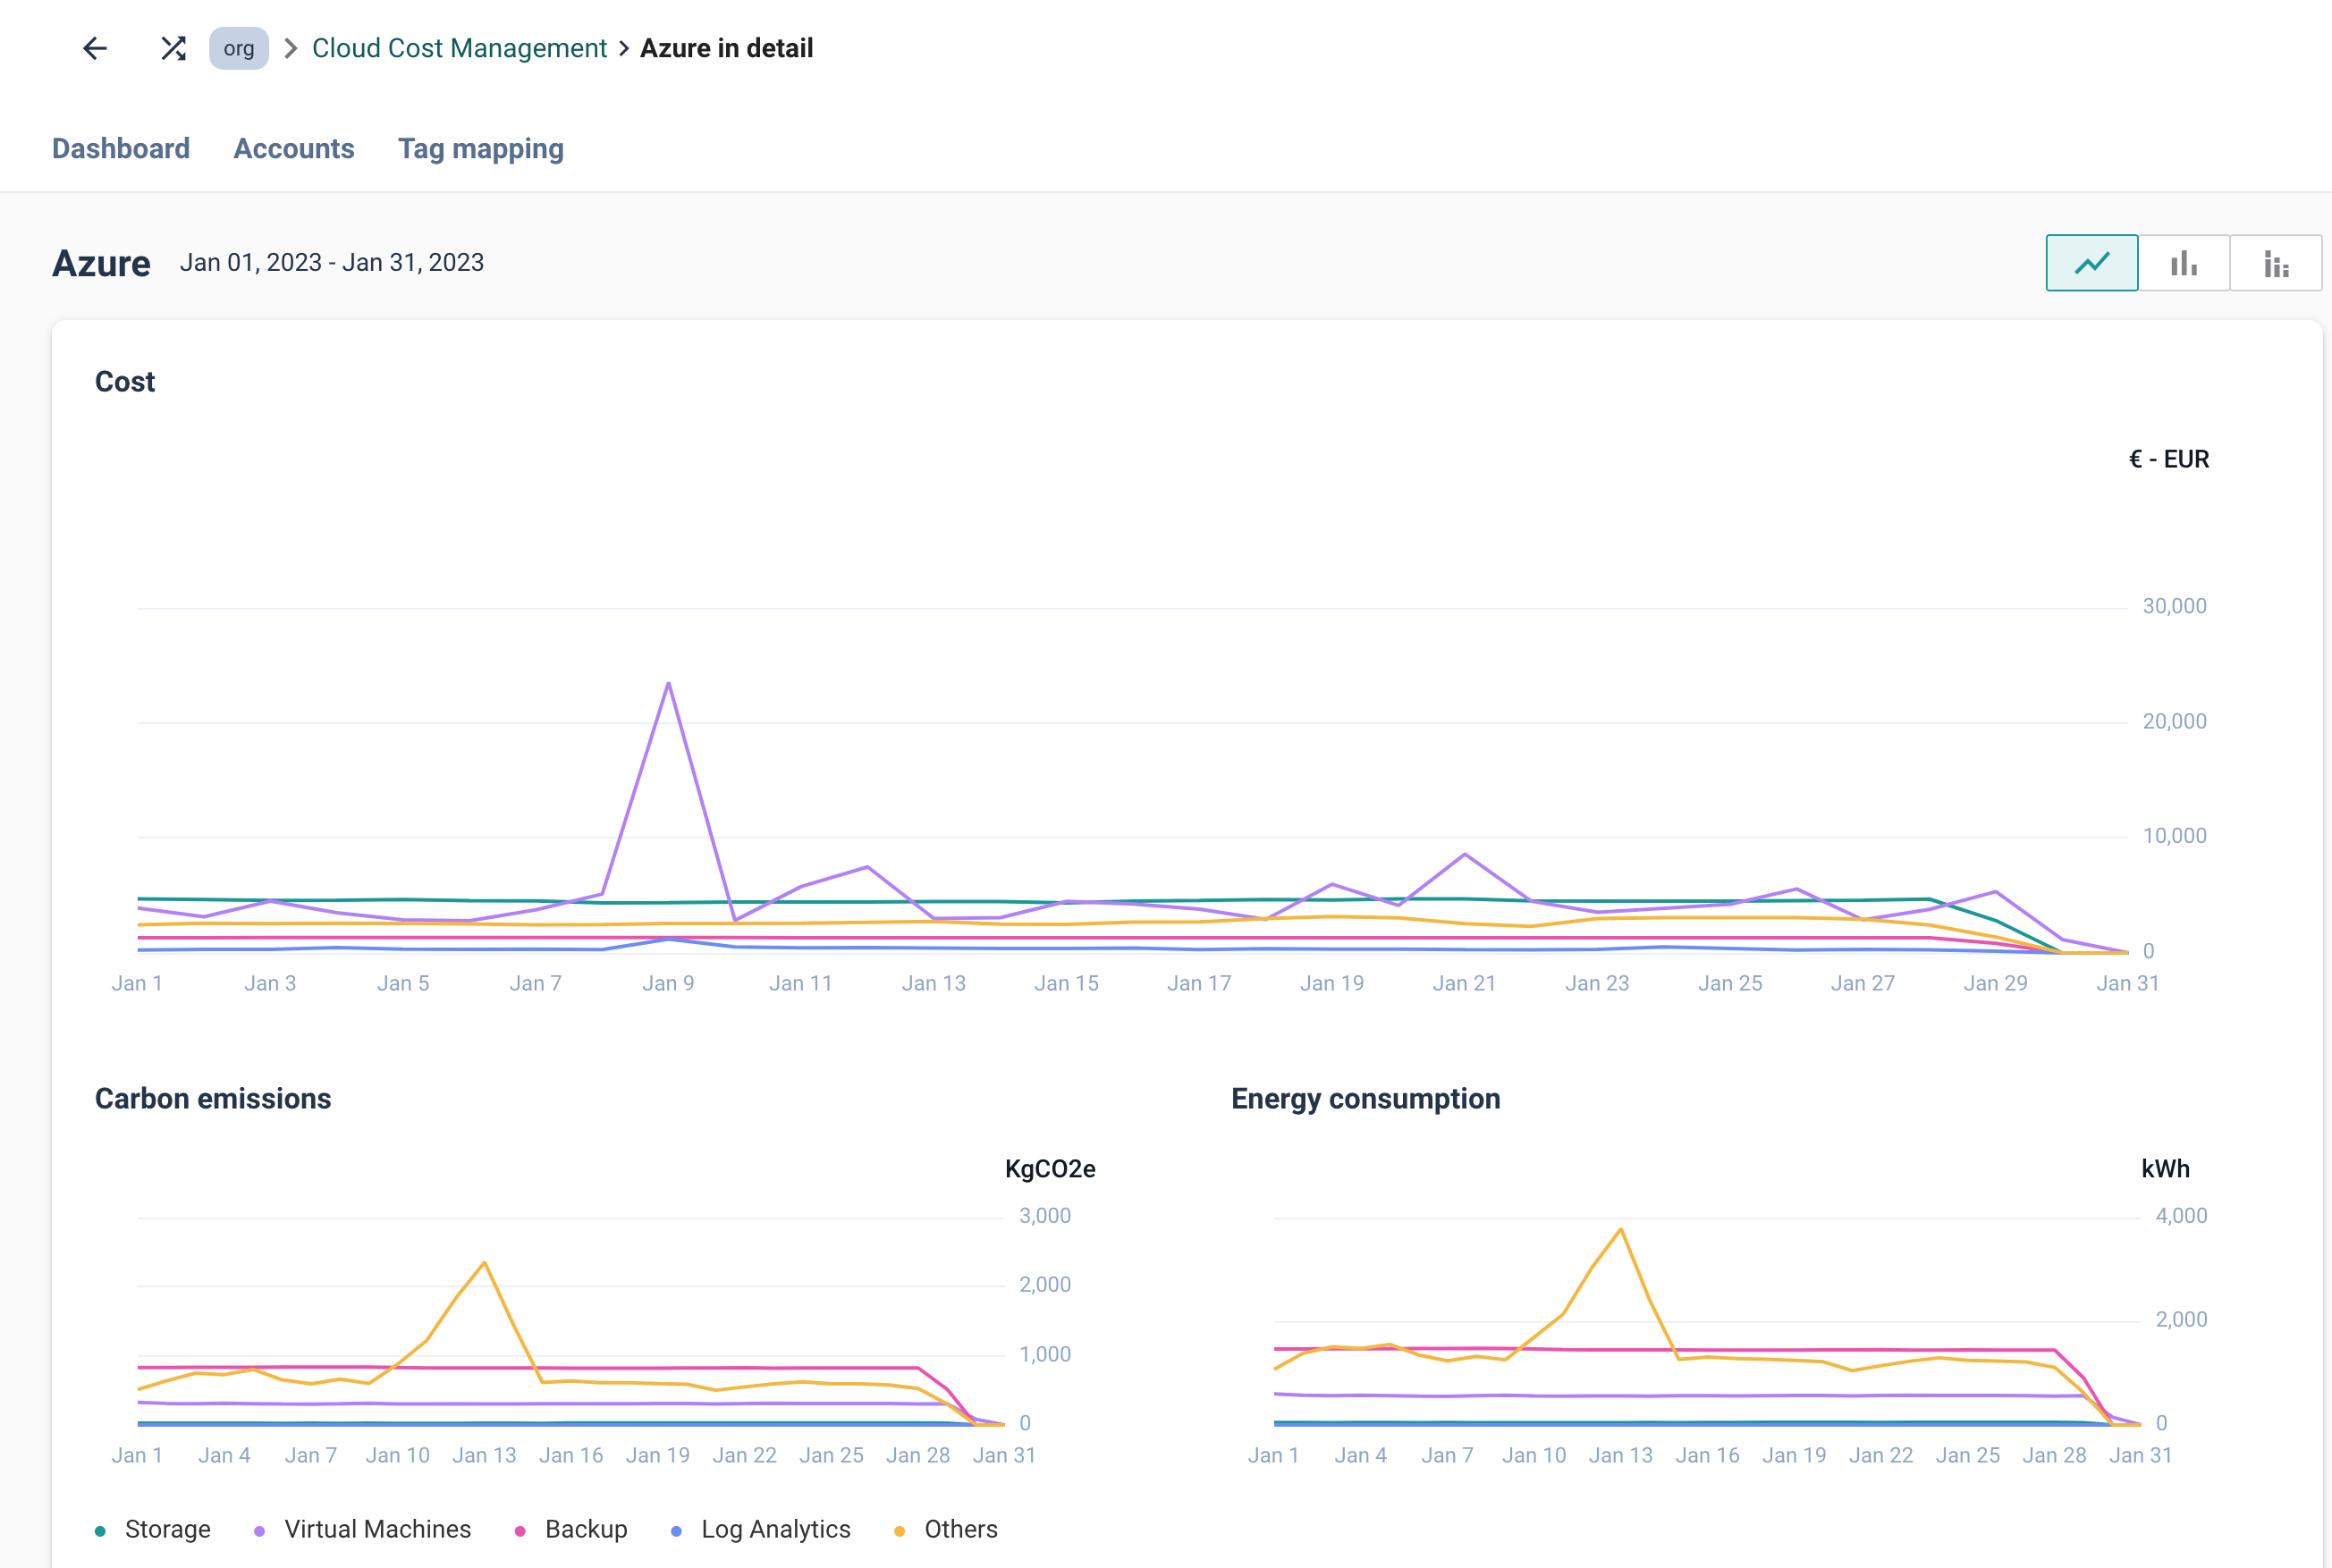
# Provider detail
This is where you'll be able to see detailed data for the selected cloud provider.
There are three different visualizations to choose (and more to add in the future): currently, there's a line view, bars, and stacked bars.
# Filters sidebar
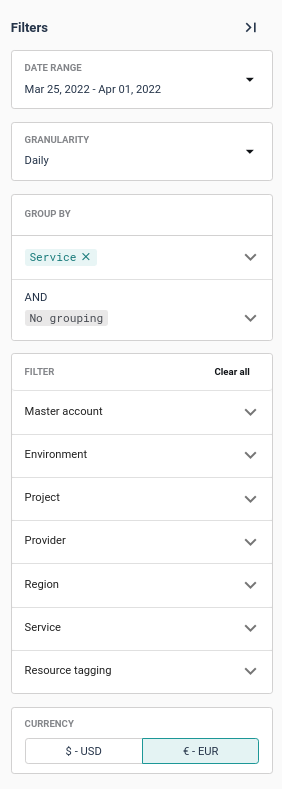
This sidebar is similar to the ones found in the dashboard, but you'll notice it's taller and contains way more filters.
Data range and granularity can still be changed from here - and this will be reflected in the next query made to get the aggregated data when going back to the dashboard.
There are two different nesting levels of grouping, which can be chosen using the GROUP BY widget: from there, you'll be able to display data grouping by Project, Environment, Service, Resource, etc.
Filtering, like in the dashboard, can also be applied.
← Dashboard Tag mapping →